Explore the Data
One of the aims of the project is to make the findings accessible to anyone who is interested in finding out more about Sustainable Forest Management (SFM) and carbon reduction in South East Asia. To help achieve this the data and analysis from the project can be browsed in a Google Earth viewer online. The data available are as follows:
- Carbon and income projections for Village 4
- Carbon and income projections for Village 5
- Carbon and income projections for Village 6
- Historical data showing how the forests have changed between 2004 and 2009
- Satellite classification results showing carbon content extrapolated to the wider area
 Each data-set listed loads as a series of maps on the Google Earth plug-in. The Data Explorer has been optimized for Firefox and requires the Google Earth plug-in to be installed.
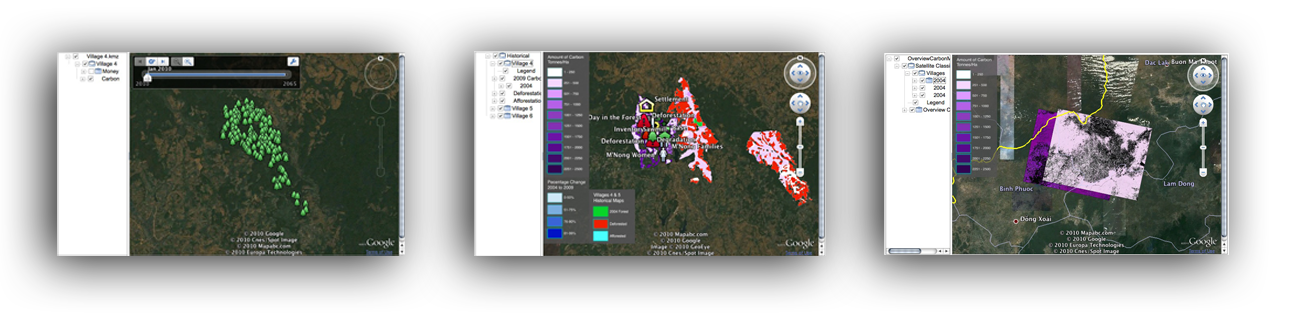
Carbon and Income Projections
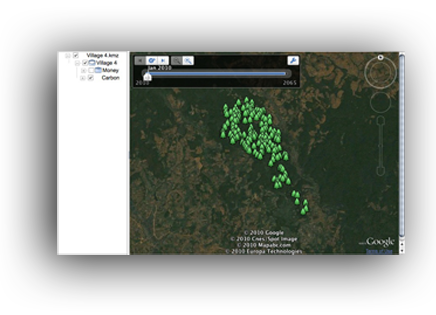 The carbon and income projection layers show the output of the carbon projection model for the next 50 years in 5 year intervals for the carbon and at 3 stages for the income. The model outputs for four SFM scenarios and a ‘business as usual’ baseline scenario are shown and can be viewed separately by clicking on and off the check-boxes by the relevant folders in the folder tree. The SFM scenarios are harvesting intervals of 3, 5, 7 and 10 years (e.g. Scenario 5 = harvest interval every 5 years).
The carbon in the forest is represented by the density of tree symbols in the forest areas. As the data is ‘played’ through time using the Google Earth time-slider the density of the tree symbols changes according to the expected per hectare density of carbon every 5 years until 2060.
The amount of money that the local people can expect to make with a SFM plan over the baseline is shown as graphics. These values are summations of projected income and are therefore dependent on the duration of the project. For that reason the money values are displayed for 20, 30 and 50 year project durations. These images will also change as the time-slider is played and by clicking on the placemark the details of the graphic are displayed in a balloon.
Historical
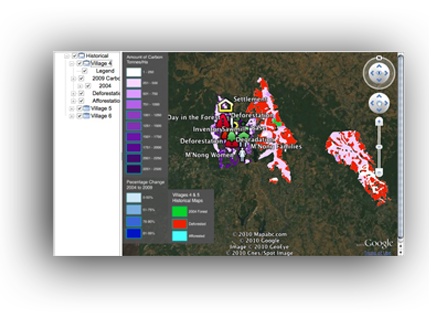 The Historical Data looks at how the forests have changed in the last five years: in terms of degradation and deforestation
Only Village 6 has a reliable forest inventory from 2004 therefore we have calculated a degradation map with percentage carbon change for that forest only. The degradation is shown in broad percentage change ‘bins’ for the 2009 area of the forest. The deforested areas in Village 6 also have carbon values from the 2004 inventory
Villages 4 and 5 have deforestation maps that show how the shapes of the forests have changed between 2004 and 2009 although without the amount of carbon lost in that deforestation. Current (2009) carbon maps created by interpolating the forest inventory data are displayed with carbon density values. Afforestation is also shown as a separate layer.
Fieldwork
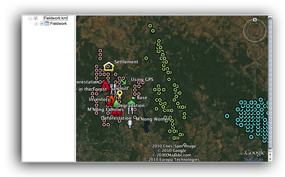 Fieldwork data are included to give a sense of the magnitude of data collection that is required in a forest inventory. Points are shown in the Google Earth viewer where the trees were measured. A few placemarks with pictures and information about the inventory are also included for interest.
Satellite Classification
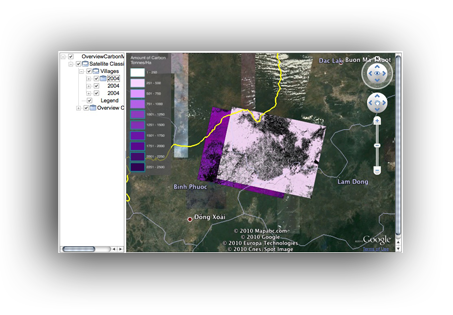 Satellite classification was performed to confirm the results from the forest inventory, give an approximation of the carbon content in 2004 and extrapolate the data collected in the forests to the wider area. The maps shown used the inventory data to calibrate algorithms that estimate the vegetation coverage from the spectrum of light detected in the SPOT sensor.
Two maps are displayed: one for 2004 and the other for 2009. The maps are images overlaying the Google Earth surface and have some pixelation at close range. Both the 2004 and the 2009 maps can be rationalized by the same legend shown on the left of the viewer. The outlines of the villages 4, 5 and 6 are shown for geographical reference.