Satellite Image Processing
The satellite images were used in three principle ways:
- To determine the areas of forests for the inventories
- To determine the deforestation from 2004 to 2009
- To verify the carbon estimates using image analysis
Areas for Forest Inventory
The forest areas were determined by a combination of visual inspection of the 2009 satellite image and rough ground measurements with a hand-held GPS device. This iterative process of digitizing the forest, checking and adjusting was necessary because the satellite images were more than six months old. Unfortunately, six months is sufficient time for significant deforestation to have taken place. The result was good quality maps of the perimeter of the forest areas which would then be populated with locations at which the inventory measurements would take place.
Forest Cover Change
Deforestation was determined by comparing the 2004 forest cover map with 2009. Of course the 2004 forest perimeter could not be verified by in situ measurements. The measurements for the 2009 map were made to guide the inventories and not to alleviate doubt about the perimeter determined from the SPOT image, it is likely that the satellite alone is sufficient for 2004. As a result, the 2004 forest perimeter is from March and the 2009 from October. The two forest shapes were subtracted from one another leaving the forest change: deforestation and afforestation.
Carbon from Satellite
Satellite images from 2004 and 2009 were analyzed to estimate the carbon content in the area surrounding the pilot studies. The data gathered in the inventories were required to parameterize the algorithms that can estimate vegetation cover using the multiple bands of light detected by the SPOT satellites. The procedure is technically involved and uses Normalized Difference Vegetation indexing.
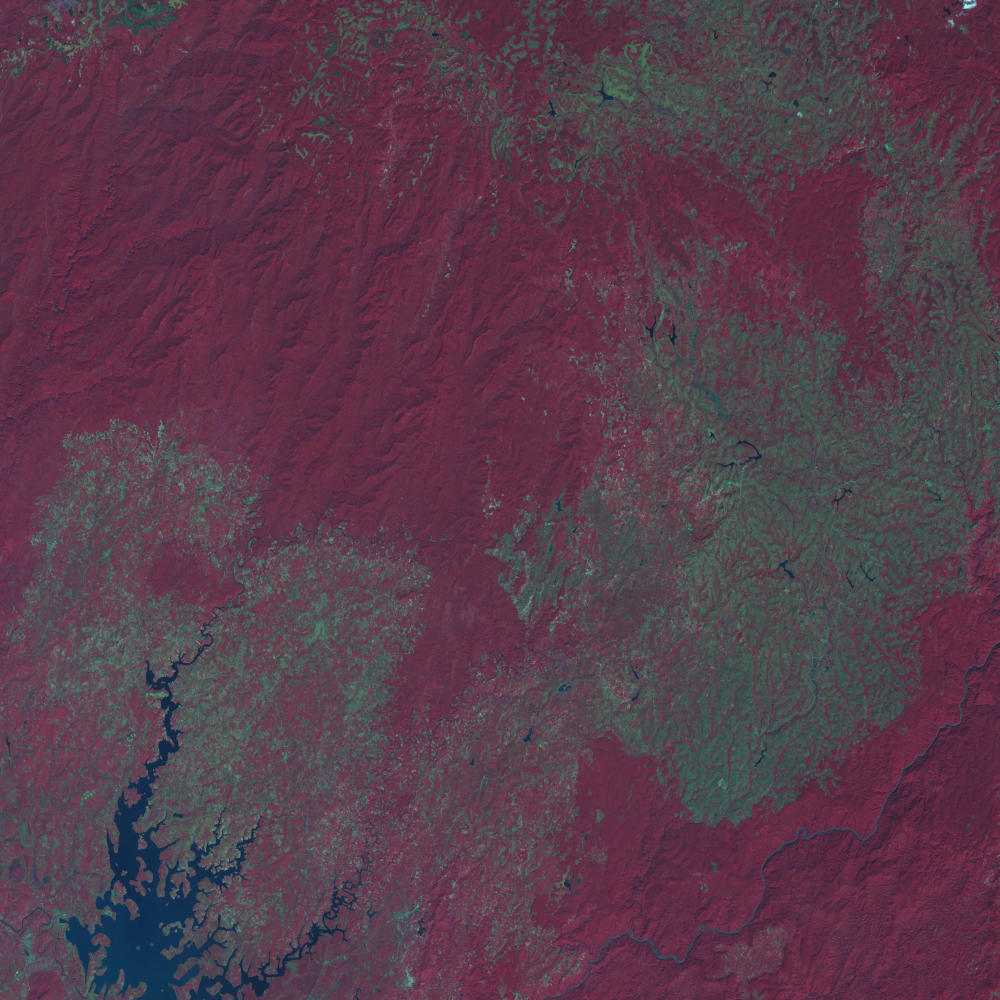 © Cnes 2010 - Distribution Spot Image